


Clean Water Advocacy - Newsroom - AMSA in the News
Water World
(c) 2004 Gale Group. All rights reserved.
Friday, October 1, 2004
ISSN: 1083-0723; Volume 20; Issue 10
EPA Reports on CSO, SSO Discharges
(Cover Feature)
The Environmental Protection Agency has released a report to Congress on the
extent of human health and environmental impacts caused by municipal combined
sewer overflows (CSOs) and sanitary sewer overflows (SSOs), including the
location of discharges, the volume of pollutants discharged, the constituents
discharged, the resources spent by municipalities to address these impacts, and
the technologies used. This is the second of two reports that Congress requested
on the impact of CSO and SSOs. The first report was sent to Congress in December
2001 as Report to Congress--Implementation and Enforcement of the Combined Sewer
Overflow Control Policy.
In its new report, EPA estimates that the annual CSO volume is approximately 880
billion gallons, down from over 1 trillion gallons prior to the CSO Control
Policy. EPA also estimates that the number of CSO events has dropped from
approximately 60,000 prior to the CSO Control Policy, to around 43,000, or a
reduction of 28 percent since the issuance of the CSO Control Policy.
The EPA report demonstrates that the nation's clean water agencies are working
hard to improve public health and the environment, according to Ken Kirk,
Executive Director of the Association of Metropolitan Sewerage Agencies.
"Clean water facilities have done an outstanding job in reducing sewer overflows
but federal funding is needed to address the $88 billion and $50.6 billion EPA
estimated cost to fully control SSOs and CSOs, respectively, over the next 20
years," Kirk said. "It is imperative that EPA also develop a flexible SSO policy
that incorporates watershed planning principles and allows communities to direct
resources to those areas that will best improve public health and the
environment."
This second study; "Report to Congress on the Impacts and Control of CSOs and
SSOs" is organized into sections addressing both CSOs and SSOs:
* Characterization
* Environmental impacts
* Human health impacts
* Control technologies
* Resources spent

The following article provides a synopsis of each section and is based on the
Report's Executive Summary. A full copy of the report is available on the
Internet at http://www.epa.gov/npdes/csos-soreport2004.
Characterization
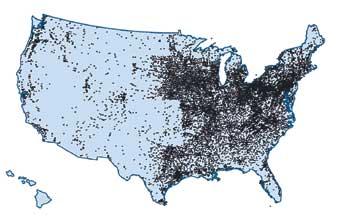
Currently, 828 NPDES permits authorize discharges from 9,348 CSO outfalls in 32
states (including the District of Columbia). Most Combined Sewer Systems (CSSs)
are located in the Northeast and Great Lakes regions.
The estimated volume of CSO discharged nationwide is 850 billion gallons per
yew. The number of CSSs and CSO permits has decreased slightly since publication
of EPA's 2001 Report to Congress. Further, the percentage of CSO long-term
control plans (LTCPs) that have been submitted to permitting authorities has
increased from 34 to 59 percent.
EPA's 2000 Clean Watersheds Needs Survey (CWNS) Report to Congress reported
15,582 municipal Separate Sewer Systems (SSSs) with wastewater treatment
facilities. An additional 4,846 satellite SSSs collect and transport wastewater
flows to regional wastewater treatment facilities.
EPA estimates that between 23,000 and 75,000 SSO events occur per year in the
United Stares, discharging a total volume of three to 10 billion gallons per
year. This estimate does not account for discharges occurring after the
head-works of the treatment plant or backups into buildings caused by problems
in the publicly owned portion of an SSS.
The majority of SSO events are caused by sewer blockages that can occur at any
time. The majority of SSO volume appears to be related to events caused by wet
weather and excessive inflow and infiltration.
CSOs and SSOs contain untreated wastewater, and therefore the pollutant
concentration depends on the service population, the characteristics of the
sewer system, weather conditions, any treatment provided, and other factors.
The principal pollutants present in CSOs and SSOs are:
* Microbial pathogens
* Oxygen depicting substances
* Total suspended solids (TSS)
* Toxics
* Nutrients
* Floatables and trash
Pollutant concentrations in CSOs and SSOs vary substantially, not only from
community to community and event to event, but also within a given event. CSOs
and SSOs contribute pollutant loadings to waterbodies where discharges occur, it
is important to note that waterbodies also receive pollutants of the types found
in CSOs and SSOs from other sources such as storm water runoff.
Environmental Impacts
Pollutant concentrations in CSOs and SSOs may be sufficient to cause a violation
of water quality standards, precluding the attainment of one or more of the
designated uses (e.g., swimming, boating, fishing) for the waterbody.
CSOs and wet weather SSOs discharge simultaneously with storm water runoff and
other nonpoint sources of pollution. EPA recognizes that this can make it
difficult to identify and assign specific cause and effect relationships between
CSOs, SSOs, and observed water quality problems. In addition, EPA found that the
identification and quantification of environmental impacts caused by CSOs and
SSOs at the national level is difficult because there is no comprehensive
national data system for tracking the occurrence and impacts of CSOs and SSOs.
Nevertheless, CSOs and SSOs can by themselves affect the attainment of
designated uses and cause water quality standards violations. Average bacteria
concentrations in CSOs and SSOs may be several thousand times greater than water
quality standard criteria, and waterbodies that receive CSO and SSO discharges
may lack sufficient dilution or assimilative capacity.
Based on modeling analysis conducted by EPA, water quality standards are
projected to be violated frequently, even in the absence of other sources of
fecal coliform pollution, where discharges from SSO events include more
concentrated wastewater (e.g., SSOs with limited I/I) or when SSOs discharge to
smaller receiving waters such as a stream or small tributary.
CSOs were responsible for 1 percent of reported advisories and closings, and 2
percent of advisories and closings that had a known cause during the 2002
swimming season. SSOs were reported to be responsible for 6 percent of reported
advisories and closings, and 12 percent of advisories and closings having a
known cause. Studies also identify CSOs and SSOs as a cause of shellfish
harvesting prohibitions and restrictions in classified shellfish growing areas.
The environmental impacts of CSOs and SSOs are most apparent at the local level,
and as the result of large or recurrent discharges.
Human Health Impacts
Although it is clear that CSOs and SSOs contain disease-causing pathogens and
other pollutants, EPA has limited information on actual human health impacts
occurring as a result of CSO and SSO events. Further, CSOs and wet weather SSOs
also tend to occur at times (e.g., storm events) when exposure potential may be
lower.
Identification and quantification of human health impacts caused by CSOs and
SSOs at the national level is difficult due to a number of factors, including
under-reporting and incomplete tracking of waterborne illness, contributions of
pollutants from other sources, and the lack of a comprehensive national data
system for tracking the occurrence and impacts of CSOs and SSOs.
As an alternative to direct data on human health impacts, EPA modeled the annual
number of gastroenteritis cases potentially occurring as a result of exposure to
water contaminated by CSOs and SSOs at BEACH survey beaches. EPA found that CSOs
and SSOs are estimated to cause between 3,448 and 8,576 illnesses annually at
the subset of recreational areas included in the analysis.
Technologies Used to Reduce Impacts
Municipalities employ a wide variety of technologies and operating practices to
maintain existing infrastructure, minimize the introduction of unnecessary waste
and flow into the sewer system, increase capture and treatment of wet weather
flow reaching the sewer system, and minimize the impact of any subsequent
discharges on the environment and human health. For this Report to Congress,
technologies used to address CSOs and SSOs have been grouped into five broad
categories:
* Operation and maintenance practices
* Collection system controls
* Storage facilities
* Treatment technologies
* Low-impact development techniques
EPA, states, and municipalities have made progress in developing tools and
strategies for reducing the frequency and volume of CSOs and SSOs.
Much remains to be done, however, to fully realize the objectives of the Clean
Water Act and the CSO Control Policy Municipalities have suggested that limited
resources prevent them from acquiring and implementing technologies as quickly
as they and regulatory agencies would prefer, ETA reported.
Resources Spent
Municipal resources used to address CSOs and SSOs are documented in different
ways. ETA's estimates of municipal CSO expenditures rely on requests for Clean
Water State Revolving Loan Fund (CWSRF) loans and on documents submitted to
EPA's CWNS, which include CSO LTCPs and other facility planning documents. In
addition, ETA uses a cost curve methodology to estimate costs toe communities
with CSSs that do not submit documentation.
In communities served by SSSs, SSO control expenditures are generally a
combination of general operation and maintenance (O&M) and capital expenditures.
In total, ETA documented expenditures of more than $6 billion on CSO control
(through 2002) and at least $4 billion on SSO control (1998-2002). EPA's 2000
CWNS estimated that at least an additional $50.6 billion is required to capture
no less than 85 percent of the CSO by volume, and an additional $88.8 billion is
required to control SSOs over the next 20 years.
Actions Needed
In its preparation of its report, EPA found that:
--Maintaining and improving the integrity of the nation's wastewater
infrastructure will protect the high level of environmental quality and public
health enjoyed in the United States.
--Proper O&M of the nation's sewers is integral to ensuring that wastewater is
collected, transported, and treated at POTWs; and to reducing the volume and
frequency of CSO and SSO discharges.
--Many existing structural and non-structural technologies are well suited for
CSO and SSO control.
--Emerging technologies and innovative practices hold promise for even greater
reductions in pollution.
--Municipal owners and operators of sewer systems and wastewater treatment
facilities need to manage their assets effectively and implement new controls,
where necessary, as this infrastructure continues to age.
--The impacts of CSOs and SSOs are a concern at the local watershed level.
CSOs and SSOs are two among many sources of pollutants that contribute to urban
water quality problems. The watershed approach is central to water quality
assessments and the identification of control strategies must include all
sources of pollution affecting water quality. The presence of sewer systems in
most developed water sheds nationwide underscores the importance of considering
potential SSOs impacts on water quality. Similarly, the presence of CSOs in 32
states places them in many watersheds across the country.
EPA, states, and municipalities should strive toward better integration of wet
weather programs with other NPDES, compliance assistance, and enforcement
activities. Better integration of programs and activities at the watershed level
will provide economies of scale with respect to monitoring and reporting,
protecting water quality, and reducing the impacts of CSOs and SSOs.
--Improved monitoring and reporting programs would provide better data for
decision makers on CSO and SSO control.
Better tracking of environmental impacts and the incidence of waterborne disease
would increase national understanding of the environmental and human health
impacts associated with CSOs, SSOs, and other sources of pollution. Use of
standardized reporting formats for information on the occurrence and control of
CSOs and SSOs would enable EPA, states, and others to track pollutant loads and
the performance of controls.
Recent EPA efforts such as WATERS (Watershed Assessment, Tracking, and
Environmental Results) work to unite national water quality information that was
previously available only from several independent and unconnected databases.
EPA will continue to work to improve the information available.